Monitoring SharePoint Online storage: why it matters and how I automated it
Why you should keep an eye on SharePoint Online storage over time, the role of file-level archive and SharePoint Advanced Management inactivity policies, and how I built an automatic history with PowerShell, Microsoft Graph API and PnP with Power BI dashboards in mind.
In this article6sections
Why I decided to monitor SharePoint Online storage
Storage is one of those aspects of Microsoft 365 governance that tends to stay invisible until it becomes a problem. Nobody checks how much space is being used on SharePoint Online until a notification arrives saying the quota is running out, or until someone has to justify an additional storage cost that nobody saw coming. By then, though, working out what is happening and since when is much harder than if you had been watching it all along.
This article explains the thinking behind a small tool I built to keep track of SharePoint storage on a weekly basis, and above all two things I want to share: why I chose to treat “normal” storage separately from file-level archive storage, and why I decided to build myself a persistent history with future use in Power BI already in mind.
Why monitoring storage is important, not just “useful”
On an enterprise tenant, SharePoint storage never grows in a linear or predictable way: it depends on hundreds (or thousands) of teams uploading files on their own, each with their own habits. Without continuous monitoring, the only signal you get is reactive: a quota approaching its limit, a ticket, an alert email from Microsoft. At that point the question “how did we get here?” almost never has an immediate answer, because nobody has been tracking growth over time.
Having a weekly trend of how much we are using, how much we are growing and at what pace, on the other hand, lets you move from a reactive approach to a predictive one (forecasting): you can estimate when a given threshold will be reached, decide in good time whether you need to buy additional storage, spot abnormal growth spikes perhaps linked to a single site or project, and bring concrete numbers to a budget discussion rather than a gut feeling.
File-level archive: a problem of control, not just of space
There is one aspect of storage monitoring that I think deserves particular attention, and it is the reason I kept file-level archive (introduced with Syntex) separate from the rest: unlike site-level archiving, here it is not the administrator who decides what gets archived.
Archiving an entire site is an administrative action: someone deliberately decides that the site is no longer active and moves it to the archive. File-level archive works differently: today it is the user themselves, with edit permissions on the library, who can select one or more files and archive (or reactivate) them on their own, without the administrator deciding or having to approve it case by case — and this can happen to individual files inside a perfectly active site, through decisions taken downstream by the people using that library, not by those who administer the tenant. Microsoft has already announced that policy-based automation will also arrive by the end of 2026 (for example archiving files that have not been accessed for a certain number of days), but for now the mechanism that actually moves storage is in the hands of the people working on those files every day, not in a centralised rule that the admin can read or anticipate.
The result is that storage “moves” without the administrator having direct visibility of what is being archived and where. It is not a space problem (if anything, archiving should free some up), it is a problem of loss of control and visibility: if you don’t monitor it explicitly, you lose any sense of how much content is actually “living” in an archived state within active sites, with implications for access times, user experience and, in some cases, compliance. That is why I treat it as a metric in its own right: I don’t want it mixed in and hidden inside the aggregate active storage figure, I want to be able to look at it separately and see whether it is growing silently.
The link with SharePoint Advanced Management inactivity policies
There is also a second, more operational reason why I keep this monitoring running: I am using it alongside the site inactivity policies available in SharePoint Advanced Management, the ones that identify and, if configured, automatically archive sites that are no longer in use. Here too the logic is the same as with file-level archive: it is a policy, not an administrator, that decides when a site becomes “inactive” and is moved to the archive.
Having a storage history lets me read the real effect of these policies over time: how many sites are actually being archived week after week, how much space is being “reclaimed” from active storage as a result, and whether the pace of archiving matches what I expect from the policy configuration. Without a historical trend, even the effectiveness of these automations would remain a number you can only check at a single point in time, rather than a piece of work whose progress you can verify.
A history built to last, not just for today’s email
The weekly email report is handy for a quick read, but an email is not a good place for a history to live: you can’t query it, it doesn’t lend itself to analysis, and if in future I want to cross-reference this data with other data (growth by department, correlation with projects, comparison between different tenants), starting from a mailbox is the worst possible choice.
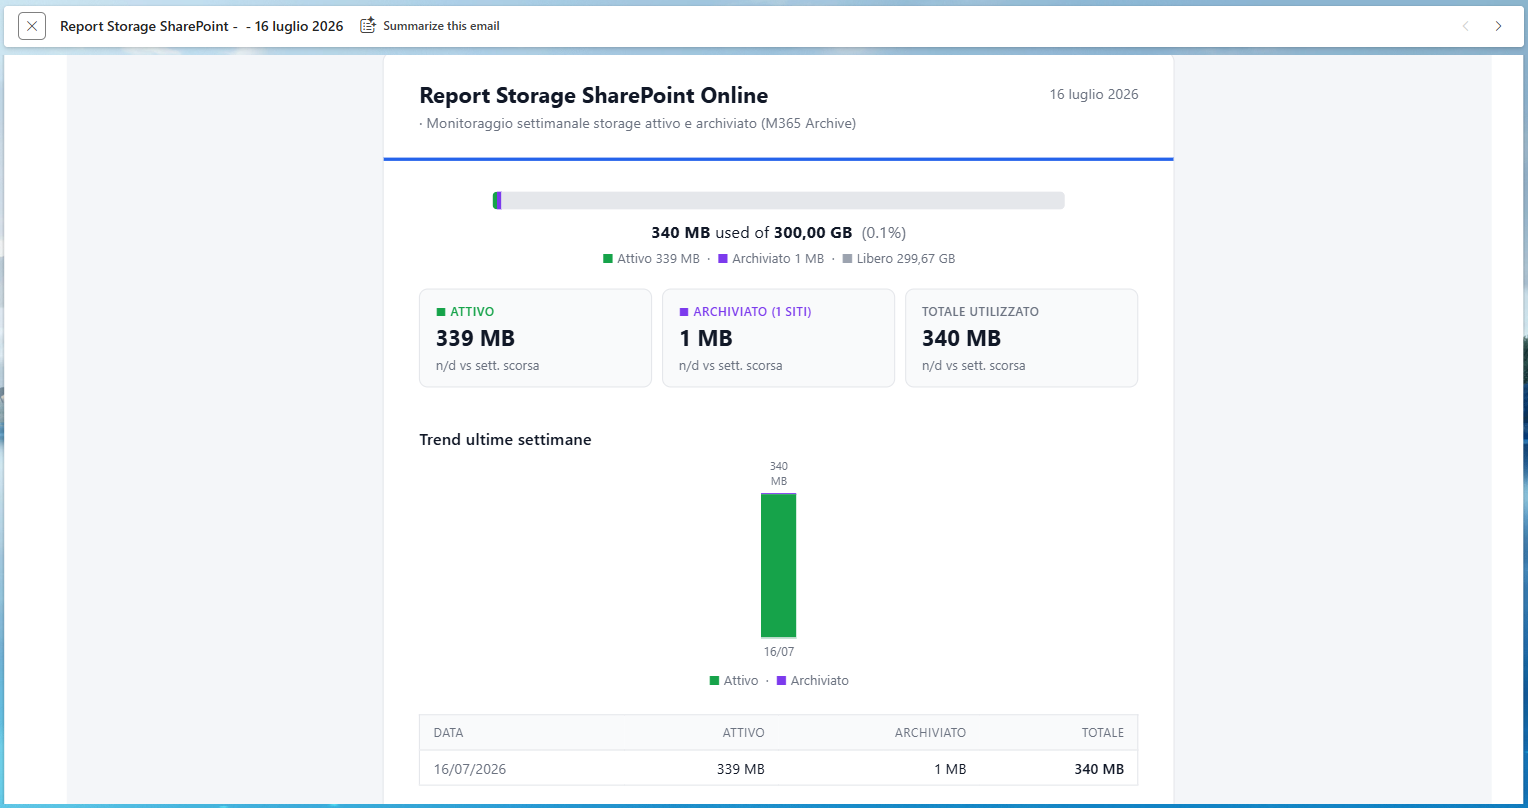
That is why, in addition to sending the report, each run automatically records a history row — date, active storage, archived storage, total, quota percentage — in a dedicated SharePoint list, populated via PnP PowerShell. It is a deliberately simple choice: no external database to manage, no additional infrastructure, just a list that builds up reliably week after week, inside the very environment I am already monitoring.
The reason this choice particularly interests me is what you can build on top of it: a SharePoint list is a data source that connects natively to Power BI, which is exactly the direction I want to go in. The idea is to move from a “static” email report to interactive dashboards refreshed automatically every week, where I can slice the data by period, compare trends over longer timeframes than the 8 weeks I show in the email, and perhaps cross-reference storage with other governance metrics I am already collecting with other tools. It is an area I am actively working on, and it will probably be the subject of a future article once I have something more concrete to show.

A slightly more technical look: APIs, authentication and flow
For anyone curious about how the tool is actually built, without going into the code: authentication is entirely app-only via certificate, both towards SharePoint Online Management Shell and towards Microsoft Graph, so as not to depend on a service account with a password to rotate or MFA to manage. On this front, a note “from the trenches”: Microsoft relatively recently introduced support for certificate authentication for the scenario I use on SPO Management Shell too, and I took the opportunity to test it directly in the field with this script, as well as for the monitoring itself.
The script queries three data sources, and they reflect exactly the “pre-aggregated wherever possible” reasoning I mentioned above:
- the total tenant quota, read directly from the SharePoint admin service;
- the aggregate active storage of all sites, obtained through the Microsoft Graph reporting endpoint dedicated to SharePoint storage usage — a figure already calculated by Microsoft and updated daily, which I therefore avoid recalculating from scratch;
- the archived storage, obtained by querying only the subset of sites that are actually in an archived state (a small number compared with the total, so quick to retrieve even on large tenants).
The flow, in short: the script authenticates, retrieves these three values, calculates the deltas against the previous run by reading the history, builds the HTML report with the KPIs and trend charts, sends it by email via Microsoft Graph, and at the same time writes the history row both to a local file and to the SharePoint list I mentioned earlier. All in a single scheduled run, with no manual intervention.
In summary
The common thread of this work is that SharePoint storage should not be seen as a static number to check when needed, but as data that tells a story if you observe it over time - and that has at least two distinct dimensions to keep an eye on separately: how much we are using in a “visible”, deliberate way, and how much is moving automatically through decisions taken by users themselves via file-level archive. Building a persistent history from the outset, even in something as simple as a SharePoint list, is what turns this monitoring from a report to read every Monday into a data foundation to build something more on, when the time comes.
Have a similar use case or want to compare notes on the approach? You’ll find my contact details on the blog.